Amazon DSP Reports in 2026: How to Build and Read Them

Archit Arora

TL;DR
Key takeaways
Amazon DSP reports now live in unified reporting; the old DSP report page goes read-only December 17, 2026 and shuts down December 31.
Each old DSP report type is now a set of dimensions: campaign, supply, audience segment, geography, technology or product.
In unified reporting, ROAS includes halo sales; the old DSP "ROAS" is now ROAS (promoted).
Read DSP weekly on pacing, frequency, viewability, cost per detail page view and new-to-brand share, and use AMC for paths and incrementality.
Amazon DSP reports used to be nine fixed report types on their own page. In 2026 they became dimensions and metrics in one report builder, most DSP metric names changed, and the page you downloaded them from closes on December 31.
This guide is for teams running DSP, now called Display, Video and Audio (DVA) campaigns. It shows how to rebuild each old DSP report, which metrics to read and how, a worked example, when to use Amazon Marketing Cloud instead, and the weekly routine we run on the accounts we manage.
What Are Amazon DSP Reports?
Amazon DSP reports are performance files for Display, Video and Audio campaigns: delivery (impressions, viewability, reach and frequency), cost and fees, engagement (clicks, video completions) and Amazon conversions (detail page views, purchases, sales, new-to-brand), broken down by campaign, ad group, ad, supply, audience, location, device or product.
In Amazon Ads Agent, the console's name since September 29, 2026, you build them under Reporting in the left navigation. That is the same builder that now serves Sponsored Products, Sponsored Brands and display ads.
Our Amazon advertising reports guide covers the migration across every ad product. This post stays on DSP: the dimensions, the metrics and how to read them.
What Changed in Amazon DSP Reporting in 2026
DSP reporting changed more than sponsored ads reporting did this year. Five changes affect every DSP number you pull.

1. The DSP Report Page Is Closing
Amazon made unified reporting generally available on June 8, 2026 and is retiring Measurement and reporting > Amazon DSP reports. Per Amazon's migration page, creation and editing stop on December 17, 2026 and the page, its schedules and its history are deleted on December 31.
Two reports DSP teams rely on can't migrate yet: the industry standard report and the conversion path report. Download their history before December 17.
DSP pixel conversion metrics (accept, lead, sign-up counts and their CPAs) are deprecated outright. They still appear in the old column picker but return no values.
2. DSP Metric Names Changed
Unified reporting uses one naming scheme across ad products. For DSP that means the base metrics now include halo, and the old base names gained a "(promoted)" suffix.
These renames come from Amazon's traffic, engagement and conversion metric references. They are the ones that break DSP spreadsheets:
Old DSP name | Name in unified reporting | What it means |
|---|---|---|
Order / Line item / Creative | Campaign / Ad group / Ad | Same objects, sponsored ads names |
eCPM | CPM | Total cost ÷ impressions × 1,000 |
Click-throughs | Clicks | Valid clicks only |
Total ROAS | ROAS | Includes halo (brand) sales |
ROAS | ROAS (promoted) | Promoted products only |
Total DPV | Detail page views | Includes halo |
DPVR | Detail page view rate (promoted) | Promoted DPV ÷ impressions |
Total eCPDPV | Cost per detail page view | Total cost ÷ detail page views |
Viewability rate | Viewable rate | Viewable ÷ measurable impressions |
Cumulative reach | User reach | Unique users exposed |
Average impression frequency | Average user impression frequency | Impressions per unique user |
Video completion rate | Completion rate (video ad) | Complete views ÷ starts |
eCPVC | Cost per completed view (video ad) | Total cost ÷ complete views |
The trap is ROAS. A dashboard that read the old "ROAS" column and now reads "ROAS" is silently comparing promoted sales with promoted plus halo sales. It will look like DSP got better overnight.
3. Conversions Moved to the Traffic Date
Unified reporting credits each conversion to the date of the ad view or click, not the purchase date. The old DSP report center used the conversion date.
A flight's total doesn't change, but the daily shape does. Expect more conversions early in a flight and fewer near the end when you compare against old exports.
4. View Attribution Changed on January 1
From January 1, 2026, DSP ads that serve in the Amazon store use a shopping-signal enhanced last-touch model with a shorter window for views. Click attribution and DSP ads served off Amazon are unchanged.
The old count survives as "all views" metrics, such as Purchases (all views), which include every ad view in a 14-day window. If DSP view-through ROAS fell in January, compare the two columns before you cut anything.
5. Reach and Frequency Became De-Duplicated
Amazon launched dynamic reach and frequency reporting at unBoxed in November 2025, added cross-campaign breakdowns in February 2026 and cross-account reporting on April 2, 2026.
You can now measure unique reach across any set of campaigns, across accounts, and across Sponsored Ads and DSP together. That one change retires a job we used to send to AMC.
How to Rebuild Each Old Amazon DSP Report
Unified reporting has no fixed DSP report types. You pick dimensions (the rows) and metrics (the columns), and each old report becomes a combination. Amazon's Dimensions reference, updated October 23, 2026, lists the former DSP name next to each new one.

Old DSP report | Dimensions to tick | Metrics we add | What we use it for |
|---|---|---|---|
Campaign | Week, Campaign, Ad group, Ad | Total cost, CPM, reach, frequency, DPVR, ROAS | Pacing, KPI by ad group, creative fatigue |
Inventory | Supply source, Site or app, Deal, Placement name | Viewable rate, CPM, invalid impression rate | Cutting low-quality sites, deals vs open auction |
Audience | Campaign, Ad group, Audience segment | Impressions, DPVR, cost per DPV, new-to-brand | Which segments find new customers |
Geography | Country, Region, DMA, Postal code | Total cost, purchases, ROAS | Regional spend against regional sales |
Technology | Device type, Operating system, Environment | CPM, CTR, DPVR | Device and creative decisions |
Products | Converted product, Product relevance | Purchases, sales, new-to-brand | Promoted vs halo sales by ASIN |
Conversion source / Off-Amazon | Conversion source, Conversion type (off-Amazon) | Off-Amazon conversions | Brands measuring their own site |
Reach and frequency | Week or Date range, Campaign; Frequency group | User reach, frequency distribution | De-duplicated reach, cap tuning |
Industry standard | Not in unified reporting yet | Download history before December 17 |
A few details are worth knowing before you build.
1. Campaign: Start at Ad Group
The campaign is rarely where a DSP decision happens. Each ad group should map to one tactic (in-market prospecting, views remarketing, purchase remarketing, streaming TV), so read the report by ad group and the campaign total becomes a sum you check, not a number you act on.
2. Inventory: Supply Source First
Supply source separates Amazon-owned inventory from third-party exchanges. Add Site or app only when a supply source looks wrong, because the site list on open exchanges runs to thousands of rows.
Deal shows programmatic guaranteed, private auction and preferred deals next to open auction. Our DSP bidding strategies guide covers when a deal earns its CPM.
3. Audience: Never Sum the Rows
One impression can match several audience segments. Amazon's dimension notes say segments "may overlap and should not be summed", so the audience report is for ranking segments against each other, not for totals.
Read cost per detail page view and new-to-brand share by segment. Our DSP targeting guide explains which segments belong at which stage.
4. Geography and Technology: Monthly, Not Weekly
These reports change targeting, and targeting changes need data. A month of spend by region or device is usually the minimum before we move budget on it.
5. Products: Product Relevance Replaces ASIN Conversion Type
The old products report's ASIN conversion type is now the Product relevance dimension: promoted or halo. Pair it with Converted product to see which ASINs a DSP campaign sold, including the ones it didn't advertise.
Watch one restriction: traffic metrics such as impressions aren't available with Converted product, because a product isn't something an impression is served to.
The Amazon DSP Metrics That Matter
DSP is bought on impressions, so its metrics start with people and attention rather than clicks. These are the ones we read on every account, with the formula Amazon uses.

1. Reach and Frequency
User reach is the number of unique users who saw at least one ad. Average user impression frequency is impressions divided by reach; for streaming TV, Amazon also reports household reach and household frequency.
Reach doesn't add up across ad groups, because the same person can be in several. For any total, use the Reach and frequency template, which de-duplicates across the campaigns and accounts you select.
The frequency distribution columns, User frequency (1) to (10+), matter more than the average. An average of 4 can hide a third of the audience seeing your ad ten times or more.
2. Viewability
Amazon counts an impression as viewable when at least 50% of the ad is on screen for one second (display) or two seconds (video). Viewable rate is viewable impressions divided by measurable impressions.
Read it by supply source and site. A cheap CPM on a site with a low viewable rate is an expensive viewable CPM, which is why vCPM is the better price to compare.
3. Detail Page View Rate and Cost per Detail Page View
Detail page view rate (promoted), the old DPVR, is promoted detail page views divided by impressions. Cost per detail page view is total cost divided by detail page views.
For prospecting, cost per detail page view is the number we steer by. It sits next to a Sponsored Products CPC as a cost to put a shopper on your product page, and our Amazon PPC metrics guide shows how to compare the two.
4. ROAS, ROAS (Promoted) and "All Views"
ROAS is sales divided by total cost and, in unified reporting, includes halo sales of other products from your brand. ROAS (promoted) counts only the products in the campaign.
Report both. A large gap means DSP is selling your range, not just the hero ASIN, which is often the point of an upper-funnel campaign. Add ROAS (all views) if you are comparing with 2025.
5. New-to-Brand
Percent of purchases new to brand is the share of purchases from shoppers who hadn't bought from your brand in the previous 12 months. Add cost per new-to-brand purchase yourself: total cost divided by new-to-brand purchases.
This is the metric that keeps remarketing honest. Our new-to-brand metrics guide covers the definitions and how to value a new customer.
6. Video Completion
Completion rate (video ad) is complete views divided by starts, and cost per completed view is total cost divided by complete views. On streaming TV, completion mostly confirms delivery; on online video it says more about the creative.
For US advertisers, Amazon's long-term sales metrics estimate the 12-month value of the detail page views, searches and purchases a campaign drives. They are the fairest way to put a video line next to a remarketing line.
Reading an Amazon DSP Report: A Worked Example
A report only earns its place if it changes a decision. Here is a mock weekly DSP report for one campaign with three ad groups (illustrative numbers), and the arithmetic we run on it.

1. Prospecting Looks Weak on ROAS and Is the Best Line
The in-market ad group spent $12,000 on 2,000,000 impressions, a $6.00 CPM. It reached 500,000 people at a frequency of 4.0 and drove 8,000 detail page views: a 0.40% DPVR at $1.50 each.
Its ROAS is 2.0 ($24,000 ÷ $12,000), and ROAS (promoted) is 1.5. But 420 of its 600 purchases were new to brand, 70%, at $28.57 per new-to-brand purchase ($12,000 ÷ 420).
2. Remarketing Looks Great and Is Mostly Buying Existing Customers
The remarketing ad group shows a 6.0 ROAS ($36,000 ÷ $6,000). Only 45 of its 900 purchases were new to brand, 5%, which makes each new customer cost $133.33.
Its frequency is 10.0 (600,000 impressions on 60,000 people). These are shoppers who already viewed the product, many of whom would have bought anyway.
3. Streaming TV Has to Be Judged on Reach
Streaming TV spent $9,000 at a $30.00 CPM and returned a 0.4 ROAS. On ROAS alone you would pause it.
But it reached 120,000 households at a frequency of 2.5, with a 95% completion rate, and 70% of its few purchases were new to brand. Its job is to fill the top of the funnel, and AMC is where you check whether those households later searched for the brand.
4. The Three Decisions
Move 20% of budget into prospecting while cost per new-to-brand purchase stays under what a new customer is worth to you.
Cap remarketing frequency and exclude recent purchasers, so it stops buying sales you'd have made anyway. Our DSP frequency capping guide has the settings.
Keep streaming TV on a reach goal and review it monthly with AMC, not weekly on ROAS.
The campaign total, a 2.36 ROAS on $27,000, would have hidden all three. And note the reach: 500,000 + 60,000 + 120,000 is not the campaign's reach, because the groups overlap. Only the Reach and frequency template gives the de-duplicated number.
When to Use AMC Instead of Standard DSP Reports
Standard reports answer "what did each ad group deliver?". Amazon Marketing Cloud (AMC), Amazon's clean room, answers questions about the same shopper across ad types and across time, which aggregated reports can't.

The question | Where to answer it |
|---|---|
Is the campaign pacing, and at what CPM? | Unified reporting |
Which audience segments and sites perform? | Unified reporting |
How many unique people did DSP and sponsored ads reach together? | Unified reporting (Reach and frequency template) |
Did shoppers who saw streaming TV later buy through Sponsored Products? | AMC (path to conversion, overlap) |
How long does a DSP-exposed shopper take to buy? | AMC (time to conversion) |
How many sales would have happened without the ads? | AMC (holdout or lift study) |
How often did each household see the ads across devices? | AMC (household fields, data from April 10, 2026) |
Who should we retarget or exclude next? | AMC audiences |
Two 2026 changes made AMC easier. Amazon added household ID and household size fields in May 2026, and at unBoxed 2026 announced the AMC Expert Tool, which writes AMC SQL from plain-English requests.
Our rule is simple: if the answer needs the same shopper seen twice, it's an AMC question. Our AMC custom audience guide covers the audience side, and the AMC paid features guide the advanced measurement.
A Weekly Amazon DSP Reporting Routine
This is the routine we run every Monday on the DSP accounts we manage, from one scheduled report delivered at 7 a.m. with Week, Campaign and Ad group as dimensions.

1. Check Pacing and Budget at Risk
Start with Delivery rate (current flight), Projected spend (current flight) and Budget at risk (current flight). A flight that will underspend needs a wider audience or a higher bid now, not in its last week.
2. Read Frequency by Ad Group
Look at the frequency distribution, not just the average. If more than a fifth of a prospecting audience sits at 10+ impressions, the audience is too small for the budget or the cap is too loose.
3. Check Supply and Viewability
Sort supply sources by spend and check viewable rate and invalid impression rate. Exclude sites that take spend at low viewability before they take more.
4. Rank Audience Segments on Cost per Detail Page View
For each prospecting ad group, rank segments by cost per detail page view and new-to-brand share. Shift budget toward the best two or three, and see our guide to excluding audiences in DSP for the cleanup.
5. Read ROAS Next to New-to-Brand Share
Report ROAS, ROAS (promoted) and percent of purchases new to brand side by side for every ad group. A high ROAS with a low new-to-brand share is a remarketing line doing its job; the same numbers on a prospecting line mean its exclusions are broken.
6. Don't Judge the Last 14 Days
DSP conversions keep attributing for up to 14 days after an ad view or click, and unified reporting puts them back on the traffic date. The last two weeks keep filling in, so make "no results" calls on older weeks.
Once a month, add geography, technology and products. Once a quarter, run AMC path to conversion, overlap and, when budget allows, a holdout test.
Mistakes We See in Amazon DSP Reporting
Comparing old and new ROAS. Old DSP "ROAS" was promoted only; new "ROAS" includes halo. Rename your columns before you compare.
Summing reach or audience rows. Both double-count people. Use the Reach and frequency template for totals and rank audiences rather than adding them.
Judging streaming TV on last-touch ROAS. It will lose to remarketing every time, because that's not what it does.
Letting remarketing take the credit. A 6.0 ROAS at 5% new to brand is mostly customers you already had.
Forgetting the January attribution change. View-through results for DSP ads in the Amazon store dropped by design. Check the "all views" metrics before cutting a campaign.
Leaving the industry standard report until December. It can't migrate, and its history disappears on December 31.
How We Handle Amazon DSP Reporting in Adbrew
Everything above works in Amazon Ads Agent. It gets heavy when DSP runs next to Sponsored Ads across several brands, and every client wants DSP shown with the rest of their Amazon numbers.
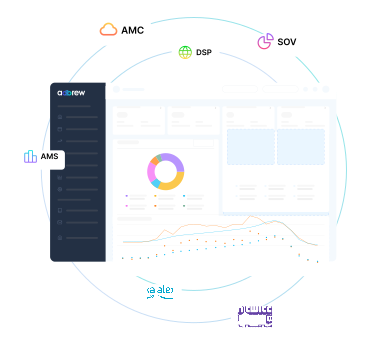
Adbrew is an agentic retail media management platform for Amazon and Walmart, and DSP reporting sits beside Sponsored Ads, AMC and Marketing Stream:
Your DSP, your way. Run Amazon DSP through Adbrew's own seat with no minimum spend, or connect a DSP account you already hold. The value is the team, the AMC audiences and the automation around it.
One view for DSP and Sponsored Ads. Custom dashboards combine DSP, sponsored ads, retail and profit data across accounts, shared by link, and white-labeled for agencies on Enterprise.
AMC without SQL. Pre-built AMC reports such as path to conversion, time to conversion, overlap and new-to-brand, refreshed daily, with audiences that activate straight into DSP.
Automation you can read. Rules on bids, budgets, audiences and frequency caps, with the thresholds and guardrails you set, and every change logged.
Reports from a sentence. Ask Adbrew Intelligence for "cost per new-to-brand purchase by DSP ad group, last 30 days", and the agent builds it. The same works from Claude or ChatGPT through the Adbrew MCP server.
K2 Health used AMC through Adbrew to lift conversions 20.28%, and more than 5,000 brands, agencies and aggregators run their Amazon advertising on Adbrew.
Rebuild the Monday Report Before December 17
Amazon DSP reports didn't lose anything useful in 2026. They gained de-duplicated reach and a shared language with sponsored ads, and they moved to a page with a deadline.
Rebuild your weekly DSP report now, rename the ROAS columns, and download the industry standard history while you still can. Want DSP, Sponsored Ads and AMC in one dashboard on your own data? Book a demo and we'll set it up with you.
Frequently Asked Questions
Where do I find Amazon DSP reports in 2026?
In Amazon Ads Agent, click Reporting in the left navigation, then Create report or pick a template, and filter Ad product to Display, Video and Audio campaigns. The old Measurement and reporting > Amazon DSP reports page stops accepting new or edited reports on December 17, 2026 and shuts down on December 31, 2026.
What types of Amazon DSP reports are there?
Amazon DSP used to offer campaign, inventory, audience, geography, technology, products, conversion source, off-Amazon and industry standard reports. In unified reporting each one is rebuilt from dimensions, such as Supply source for inventory or Audience segment for audience. The industry standard and conversion path reports can't migrate yet.
What is the difference between ROAS and total ROAS in Amazon DSP?
In the old DSP reports, total ROAS included halo sales of other products from the brand, and ROAS covered promoted products only. Unified reporting renamed them: ROAS now includes halo (the old total ROAS), and ROAS (promoted) is the old ROAS. Compare like with like when you join old and new data.
What is DPVR in Amazon DSP?
DPVR, detail page view rate, is detail page views for promoted products divided by impressions. In unified reporting it's called Detail page view rate (promoted). On 2,000,000 impressions and 8,000 detail page views, DPVR is 0.40%. Read it with cost per detail page view, total cost divided by detail page views.
Can I see Amazon DSP and Sponsored Products data in one report?
Yes. Unified reporting puts DSP and sponsored ads in one report across accounts and countries, with the same metric names. Since 2026 the Reach and frequency template also measures de-duplicated reach across DSP and Sponsored Ads together. For paths from DSP exposure to Sponsored Products purchases, use Amazon Marketing Cloud.
How do agencies report on Amazon DSP across multiple advertisers?
In unified reporting, filter by manager account or add several advertiser accounts to one report, and choose "Add current and future accounts" so new clients are included automatically. Since April 2, 2026, reach and frequency can be de-duplicated across accounts and reported by manager-account frequency group.
How do I prove Amazon DSP ROI?
Judge Amazon DSP on what each tactic was built to do: prospecting on cost per detail page view and new-to-brand share, remarketing on ROAS checked against new-to-brand share, and video on reach and completion. Then use AMC holdout or path-to-conversion analysis to measure incremental sales, which attributed ROAS can't show.
How far back can I pull Amazon DSP data?
Unified reporting keeps up to 24 months of daily and weekly data and 72 months of monthly data, per Amazon's data availability page, and a single daily-grain report covers at most 120 days. Dynamic reach and frequency covers custom periods in the past 15 months.