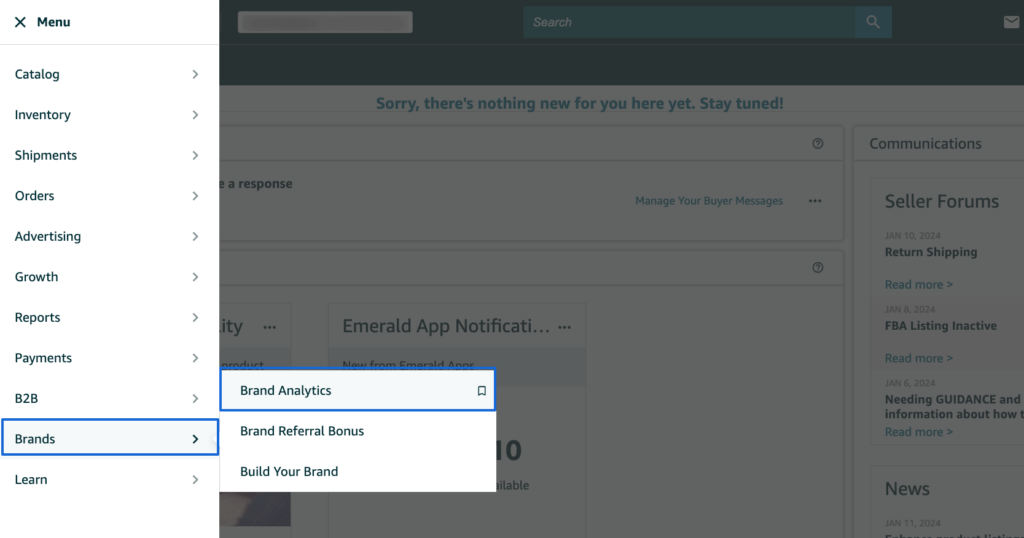
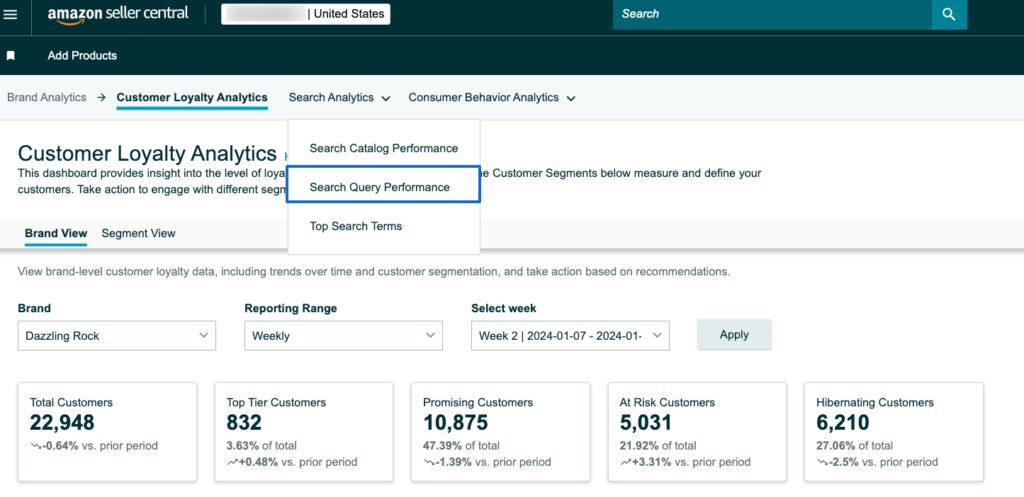
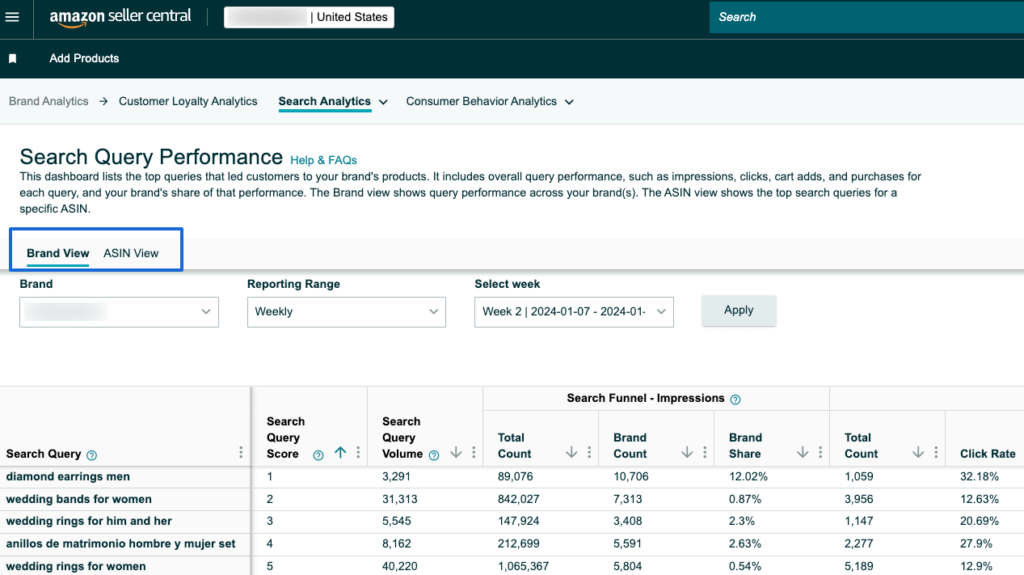
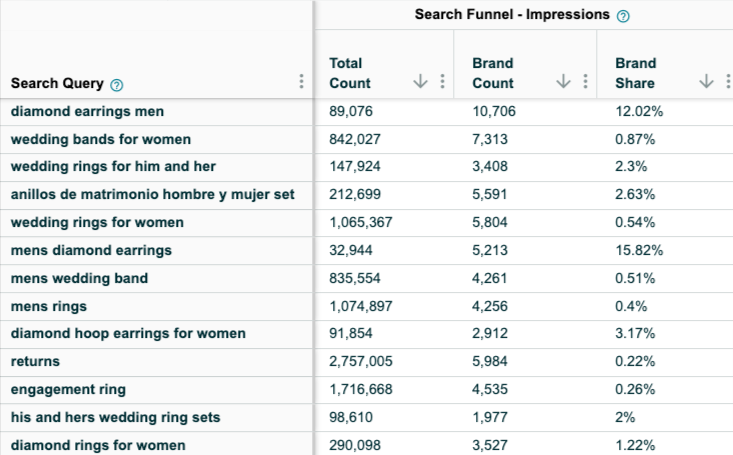
How to Utilize Amazon Search Query Performance Report?


Running Amazon ads with an empty shelf? You might as well be burning cash. Many sellers focus on optimizing bids, […]

In today’s competitive digital landscape, growing your eCommerce brand requires more than just a standalone website or a single marketplace […]

Are you an Amazon seller looking to offload excess inventory or seasonal items? The Amazon Outlet program might be just […]
Turning your bookshelf into a source of income has never been easier, thanks to Amazon. If you have books collecting […]

If you’re an Amazon seller, encountering an account suspension or policy violation can be a significant setback. But with the […]
Introduction Amazon dropshipping is an increasingly popular way to run an e-commerce business without the need to store or ship […]
Introduction The Amazon Influencer Program is a great way for content creators to turn their influence into earnings. This program […]
Introduction Amazon Kindle Direct Publishing (KDP) is a platform that allows authors to self-publish their work as ebooks or print […]
Selling on Amazon offers many opportunities for businesses, but it’s essential to understand the costs involved with Fulfillment by Amazon […]
Walmart is quickly becoming a popular platform for brands and sellers to connect with more customers. One way to boost […]
In today’s competitive retail landscape, reaching the right audience at the right time is crucial for success. Walmart’s Demand Side […]
In today’s fast-paced eCommerce landscape, shoppers demand speedy delivery. Walmart has responded by offering 2-day shipping, giving sellers on the […]
Running successful Walmart advertising campaigns takes more than just setting them up—it requires ongoing optimization. A Walmart PPC (Pay-Per-Click) audit […]

Are you ready to tap into the massive potential of Walmart Marketplace? With millions of daily visitors and a loyal […]
In the world of e-commerce, Amazon and Walmart reign supreme, dominating the retail landscape. These two giants offer vast opportunities […]
Are you a brand owner struggling to maintain control over your products on Walmart? The Walmart Brand Portal is here […]
Are you dreaming of a passive income stream from your Walmart store? The allure of an automated Walmart store with […]
Are you a seller looking to tap into the massive market of private-label brands? Walmart, one of the world’s largest […]
Tired of your Walmart products getting lost in the shuffle? In this blog post, we’ll dive into the essential strategies […]
Ever wondered why some Amazon sellers seem to have a magic touch with product bundles? It’s not luck—it’s strategy. Bundling […]

If you’re a Walmart seller looking to grow your business through retail media, Walmart Connect could be a game-changer. But […]
If you’re an Amazon seller, you may have noticed a portion of your inventory marked as “reserved” without knowing exactly […]
Have you ever wondered what managing your own Amazon orders is like? Switching from Fulfilled by Amazon (FBA) to Fulfilled […]
Walmart Marketplace offers an exciting opportunity for sellers to reach a vast audience by listing their products on Walmart’s platform. […]

Selling products on online marketplaces has become a vital strategy for businesses to reach more customers. If you’re looking to […]
Are you a Walmart seller aiming to improve your visibility and sales? In this blog, we will explore Walmart SEO, […]
As an Amazon brand owner, maintaining control over your product listings is essential to protect your brand’s reputation and customer […]
Improving your sales on Walmart starts with understanding how to consistently win the Buy Box. Securing this position can make […]
Are you an Amazon seller struggling to increase your rating? A high seller rating is crucial for attracting new customers […]
As an Amazon seller, providing the best customer service is paramount to maintaining a positive customer experience. One key metric […]
If you’re an Amazon seller and curious about Amazon IPI score and its impact on your business, this blog post […]
Introduction Starting an Amazon subscription box business presents a unique opportunity to tap into the growing trend of curated, recurring […]
Thinking about using Fulfillment by Amazon (FBA) to sell on the Amazon marketplace? Awesome! But before you box up your […]
Thinking about using Fulfillment by Amazon (FBA) to streamline your Amazon business? While FBA offers a convenient way to store […]
For FBA sellers, the Amazon Buy Box is the holy grail of product visibility. But with constant algorithm updates and […]

Have you ever wished you could offer customers pre-made packages of complementary products without the hassle of physically bundling them […]

Have you ever wanted to create a more branded and engaging presence for your products on Amazon? An Amazon storefront […]
Are you storing items on Amazon for a while? If so, it’s important to be aware of Amazon long term […]
When selling products on Amazon, it is crucial to follow their packaging requirements, rules, and guidelines. Proper packaging ensures that […]
Amazon A/B testing can significantly enhance your product listings and boost sales. This method, also known as split testing, involves […]
Have you ever browsed Amazon and stumbled upon a product with a little blue badge that reads “Amazon’s Choice“? It […]
Amazon FBA vs FBM needs to be explored, when we ship products and handle orders while selling on Amazon. With […]
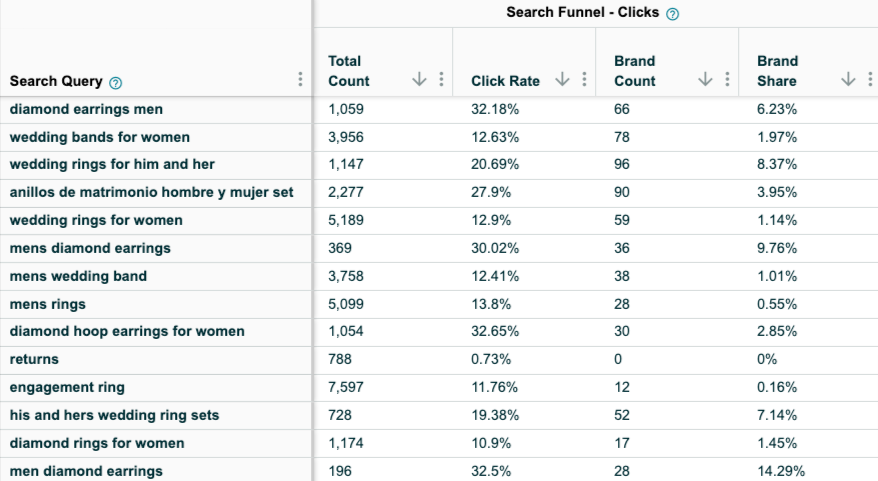
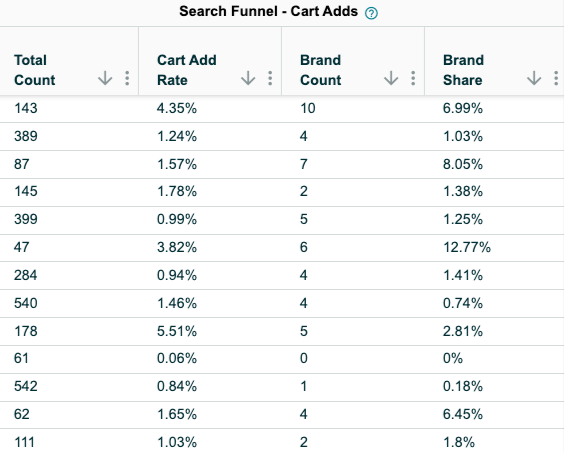
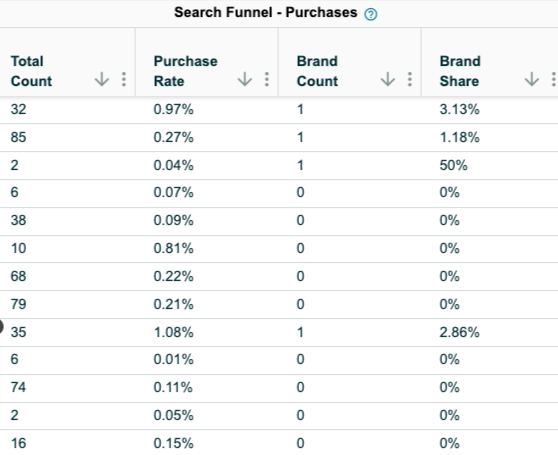
Ever feel like you’re missing something in your Amazon PPC Search Terms report? You might be! Sure, they show what […]
Amazon can be a fantastic platform to reach new customers, but keeping your virtual shelves stocked can get tricky. That’s […]
Navigating Amazon as a new seller can be tough, but there are tools and programs available to help such as […]
Have you ever scrolled through an Amazon search result page and noticed product recommendations nestled alongside the standard listings? These […]
Finding time for yourself while selling on a competitive marketplace like Amazon can be challenging. As a seller, your main […]

Starting an E-commerce business has become quite easy with Amazon, but it also brings heavy competition. Millions of Amazon sellers […]
As an Amazon seller, you know the importance of getting your products seen. But with millions of listings, how do […]
Ever scrutinized an Amazon product page and noticed the cryptic “Sales Rank”? Wondering what it means and how it impacts […]
Millions of products compete for customer attention on Amazon’s search results page, making it tough for your brand to stand […]
Are you selling products on Amazon and looking to increase your sales? This blog is for you. We’ll share tips […]
Are you an Amazon seller looking to boost your brand visibility and profitability? Are you feeling stuck in the cycle […]

Ever wonder what drives your online shopping habits? Perhaps a captivating product description, or an eye-catching professional photo? As it […]
For any seller on Amazon, understanding the A9 algorithm is crucial for success. This complex algorithm dictates which products appear […]
Are you an Amazon seller looking to turn those single purchases into recurring revenue? Look no further than the Subscribe […]
Amazon has become a go-to platform for all e-commerce business owners to launch and scale their e-commerce brands online. But […]
Mother’s Day, a time to celebrate the incredible women who raised us, is a prime opportunity for Amazon sellers to […]
In the ever-competitive landscape of Amazon, ranking high in organic search results is crucial for driving sales. While you might […]
If you’ve ever found yourself scratching your head over Sessions and Pageviews on your Amazon business reports, you’re not alone. At […]
Amazon is a massive marketplace, attracting millions of customers with diverse needs, preferences, budgets, and mindsets for shopping. To effectively […]
With Amazon boasting over $575 billion in retail sales for 2023, it’s no wonder so many sellers flock to its […]
Advertising on Amazon through pay-per-click campaigns can significantly enhance product visibility and sales for sellers. However, mastering Amazon PPC, with […]
Have you heard of the terms copyright infringement and plagiarism? If so, then Amazon Brand gating won’t be unfamiliar to […]
If you are running ads on Amazon, you’ll come across a sea of data in your advertising console. But does […]
Have you heard of the terms copyright infringement and plagiarism? If so, then Amazon Brand gating won’t be unfamiliar to […]
In the fast-paced world of e-commerce, where shoppers are bombarded with choices, standing out on platforms like Amazon is paramount […]
Are you planning to start an Amazon FBA store? If so, you’ll encounter a unique term – FNSKU. This seemingly […]
As an Amazon seller, you understand the power of reviews. They’re the lifeblood of trust and conversion on the platform. […]
Are you struggling to get Amazon reviews on your product? Well, you are not alone! Reviews are the backbone of […]
Are you tired of bland Amazon product listings failing to grab attention? In today’s competitive online marketplace, standing out is […]

As an Amazon seller, understanding how your brand performs throughout the customer journey is vital for success. However, until recently, […]
As an Amazon seller, optimizing your business and maximizing profits relies heavily on data analysis. One invaluable tool for gaining […]
Are you struggling to get noticed on Amazon’s massive platform? Do your products get lost in a sea of similar […]
For any Amazon seller getting into the world of sponsored advertising, understanding the Advertising Cost of Sale (ACoS) is crucial. […]
A well-executed Amazon product launch strategy can be the key to unlocking success and gaining a competitive edge. As the […]
In the ever-evolving landscape of e-commerce, distinguishing between keywords and search terms is vital for optimizing product visibility and driving […]

Ever felt like you are throwing darts in the dark when it comes to your marketing efforts outside Amazon for […]
Amazon, the e-commerce giant, has successfully concluded a robust business year with outstanding performance in quarter 4. The most recent […]
Picture this: you have a great product on Amazon, but it’s not selling well despite having attractive images and a […]
The advertising landscape is evolving, and viewers are rapidly migrating from traditional cable TV to streaming platforms. This presents a […]

Feeling lost in the Amazon discount jungle? Struggling to reach the right customers and entice them to make the purchase? […]
Are your products getting lost in the vast ocean of Amazon listings? Do you want them to stand out, rank higher, […]

For years, Amazon sellers were in the dark. They couldn’t see what keywords customers were using to find their products, […]
Selling on Amazon can be tough with so many others doing the same in your category. That’s why it’s super […]

For Amazon sellers, understanding their customers has often felt like navigating a maze without a map. The missing link? A […]
Have you ever felt like your Amazon advertising campaigns are lost in a tangled jungle of keywords? You’re not alone. […]
When did you last give your Amazon PPC account a checkup? Regular Amazon PPC audits are crucial to ensure the […]

Embarking on the path of online selling? If so, you’re likely aware that Amazon is your ultimate destination. With a […]
Ever felt like your product is lost in the vast Amazon jungle? You’re not alone. With millions of shoppers actively […]

Amazon Sellers selling on the Amazon marketplace usually utilize Amazon advertising without keeping a close eye on the TACoS metric. […]
The rush of Black Friday and Cyber Monday might be over, but the opportunity for continued sales growth extends beyond […]
In the fierce Amazon advertising domain, where competition rises and costs increase, understanding and keeping track of the right metrics […]
Have you ever felt the frustration of campaigns going out of budget, leading to missing out on potential sales, or, […]
Amazon PPC campaigns can be a powerful tool for driving traffic and sales to your products. However, without proper structure, they […]
Whether you are creating a new advertising campaign or optimizing existing ones, doing it manually from the Amazon ad console […]
Want to know what search terms people use to visit or purchase your product on Amazon? If yes, you’re in […]
When you are spending dollars or even more to get a click on your Amazon ads, you want to ensure […]
Are you an Amazon seller looking to maximize your profits and minimize your advertising costs? If so, you’re not alone. Many […]
Are you exclusively relying on traditional metrics such as CTR, CPC, CVR, or ROAS to make your campaign optimization decisions? […]
Navigating the ever-evolving landscape of Amazon’s online marketplace is essential for any seller looking to thrive on the platform. Among […]
As the holiday season approaches, businesses are gearing up for the highly anticipated Q4 rush. To ensure a successful Q4, […]
Do you regularly review your Amazon advertising reports? If not, you may be missing out on numerous opportunities. Amazon […]
Whether you’ve just launched a new product or have been selling on Amazon for a while, advertising on the platform […]
Amazon PPC bidding strategies that you choose play a significant role in the success of your Amazon Ads campaigns. As […]
Have you ever heard of a “catch-all campaign”? This single campaign can generate extra sales for you at a very […]
Amazon Prime Day is one of the largest global e-commerce sales events, attracting millions of customers worldwide. But how do […]
Are you looking to boost your brand’s visibility and drive more sales on Amazon? Look no further than Amazon Sponsored […]
Succeeding on Amazon in 2024 isn’t easy. Just listing your products and hoping for the best won’t work anymore. You […]
Are you bidding the same amount for all your ad placements on Amazon? If yes, then you’re missing out on […]
Whether you are looking to boost product discovery or target audiences further down the sales funnel who have already engaged […]
We, at Adbrew catalyze millions of dollars of ad spend monthly through our platform, with Sponsored Product Ads being the […]
Do you want to know how many clicks you should give a search term before adding it as negative in […]

Think of your product listing as a guiding light on the Amazon marketplace. It’s your chance to grab attention, tell […]
It is no longer a secret that shopping behavior on Amazon varies over the day. This is the reason why […]
Are you struggling to get the most out of your advertising budget on Amazon? Do you find that your campaigns […]
Ever run an Amazon Ad campaign and wondered why some sales weren’t directly linked to the products you advertised? That’s […]


If you’re managing Amazon PPC ads, it’s essential to have an effective and organized approach for target harvesting and movement. […]